

(UPDATE) From JAEA website,
The maps covers about the ocean-third of Fukushima Prefecture.
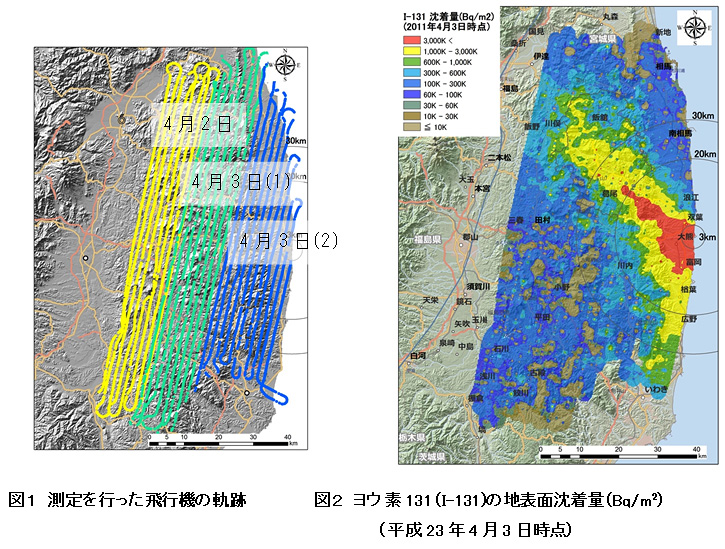
The left map shows the flight paths. The right map is I-131 deposition.
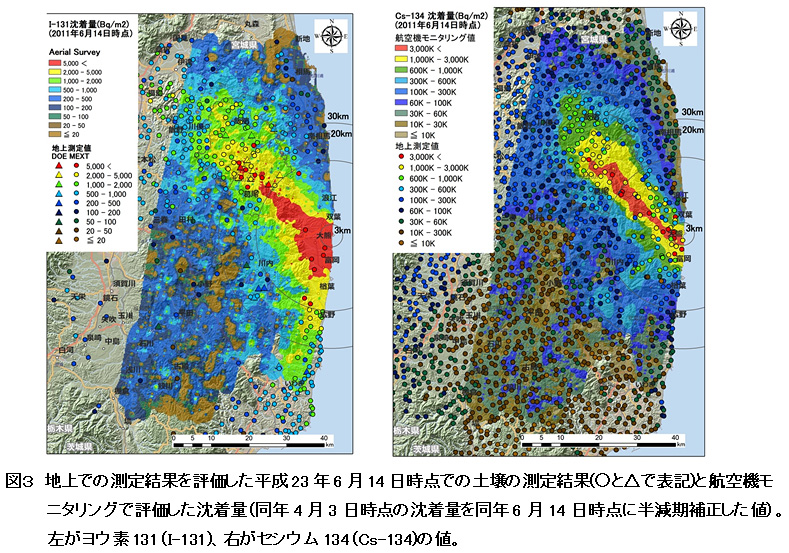
The left map is I-131 deposition, and the left map is cesium-134 deposition to show similarities and differences.
==============================
Japan Atomic Energy Agency and the US Department of Energy and National Nuclear Security Administration collaborated to create a map of iodine-131 deposition, and the paper featuring the map is to be published on June 26, 2013 in the electronic version of the official journal of Health Physics Society.
I searched JAEA site looking for the maps, and as usual their latest information is several days old, even though they just held a press conference announcing the publication.
Here's from a nuclear researcher I follow, an abstract of the paper for the 58th Annual Meeting of the Health Physics Society (7-11 July 2013, Madison, WI):
WAM-B.5 10:30 Enhanced Analysis of Early Aerial Surveys Maps I-131 Deposition from the Fukushima Daiichi Accident T Torii, Fukushima Environmental Safety Center, Japan Atomic Energy Agency ; T Sugita, Fukushima Environmental Safety Center, Japan Atomic Energy Agency; CE Okada*, U.S. Department of Energy, Remote Sensing Laboratory; MR Reed, U.S. Department of Energy, Remote Sensing Laboratory; DJ Blumenthal, U.S. Department of Energy, National Nuclear Security Administration
Abstract: During March through May 2011, the U.S. Department of Energy, National Nuclear Security Administration conducted aerial radiological surveys to characterize the severity and extent of the Fukushima Daiichi accident. The data from these surveys have previously been reported in terms of ground-level exposure rate (mSv/h) and concentrations of Cs-134/Cs-137 (Bq/m²). A small subset of the data has been re-examined with analysis techniques that were developed to exploit the gamma-ray spectral data and determine the ground-level I-131 concentration. I-131 is a short-lived (t½ = 8.04 d) radionuclide that is a potential major contributor to dose in a nuclear power plant accident. The methods developed for this analysis are described, and results of this effort are reported. *This work was done in part by National Security Technologies, LLC, under Contract No. DE-AC52-06NA25946 with the U.S. Department of Energy.
National Security Technologies, LLC is a joint venture formed in 2006 between Northrop Grumman Corporation and three other corporate partners including Babcock & Wilcox. Looks like an outsourcing outfit of Dept of Energy.
According to Mainichi Shinbun (6/27/2013):
The maps show contamination by radioactive iodine in the 400 square kilometer areas around Fukushima I Nuclear Power Plant.
The maps are based on the analysis of the data from aerial surveys done by the US Department of Energy on April 2 and 3 in 2011.
High deposition of radioactive iodine in the north-western direction from the plant, same as radioactive cesium deposition.
High deposition of radioactive iodine also in the southern direction from the plant, with areas with more than 1 million Bq/m2 extending to the north of Iwaki City.
Delay in disclosing the data is ascribed to "careful examination" by JAEA, as it was difficult to extract data for radioactive iodine as the contamination of the airplanes used in the survey was quite high.
I think this is part of the data that was freely given by the US government to the Japanese government, with the express consent by the US government to the Japanese government to distribute the data freely, but which the Japanese government decided to sit on. The data included contamination maps from data collected by Global Hawk drones in March 2011, and near-real-time video footage of Fukushima I Nuclear Power Plant also by Global Hawk in March 2011. (See my post from 2012.)
If so, JAEA may have finally figured out that the data was in GIS file format.
Radioactive iodine spreading to the south of the plant was the animation of the simulation I was watching in horror at France's IRSN site within a week (earliest simulation was on March 17, 2011) of the accident on March 11, 2011.
 Tokyo Time
![[Most Recent Quotes from www.kitco.com]](http://www.kitconet.com/charts/metals/gold/t24_au_en_usoz_2.gif)


5 comments:
Ah..for the French IRSN site, the FRENCH version is great..the English version..takes one to a Home page area..and NOTHING about the same study or results. Wonder if that is on purpose?(sarcasm)
As far as I can understand the abstract, the iodine results are inferred using a (novel?) technique they explain in the paper.
That means they will probably compare it to an actual calibrated source in the lab and say "this is great we have 5% error on a 95th percentile" (for a known source, in a lab setting).
I don't say this is not interesting, but what I mean is that the iodine maps won't probably be very accurate.
Actually, it all depends on the methodology, we would have to read the paper to find out...
And about NatSecTech llc, well, revolving door ?
Inferred as well as actual measurements, I think.
Revolving door indeed. Just like NSA-Booz Allen Hamilton.
The map doesn't show iodine levels in other prefectures, only Fukushima?
US Dept of Energy flew over part of Fukushima (ocean-third). The data does not cover even Fukushima Prefecture in its entirety.
Post a Comment